NXP S32K1xx - Application debug with PEmicro OCD on Windows
Contents
Synopsys
This guide illustrates how to run and debug an ERIKA Enterprise v3 application for S32K144EVB or S32K148EVB boards:
- Using the Eclipse environment with integrated debugger support (PEmicro OCD).
We also directly support debugging using Lauterbach TRACE32. For more information please check NXP_S32K1xx - Application build on Windows#Debugging_using_Lauterbach_TRACE32
Prerequisites
Please remember to read "Cortex-M: NXP S32K1xx application build on Windows" tutorial to obtain the full functionality described in this tutorial.
Additional information on prerequisites is available at the Quick Start Guide - Prerequisites.
PEmicro Eclipse Plugin Download
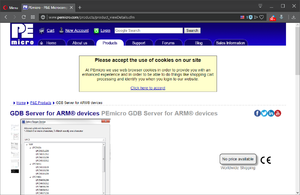
- Open your favourite web broser and go to URL PEmicro GDB Server for ARM devices as shown in the following figure:
- Scroll down the entire page and click the PEmicro GDB Server for ARM devices - Eclipse Plugin link to download PEmicro Eclipse Plugin as shown in the following figure:
- You have to insert your e-mail address into required form to receive the download link.
- Save the downloaded PEmicro Eclipse Plugin as you want into file-system.
- Currently the PEmicro Eclipse Plugin file name is com.pemicro.debug.gdbjtag.pne.updatesite-3.0.9-SNAPSHOT.zip
PEmicro Eclipse Plugin Installation
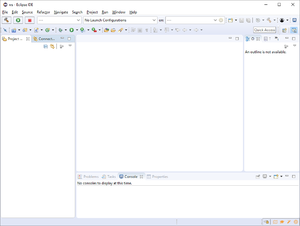
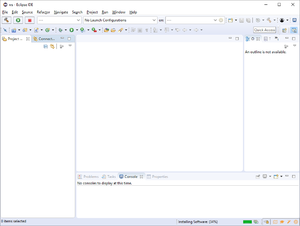
- Run RT-Druid v3 Eclipse IDE as shown in the following figure:
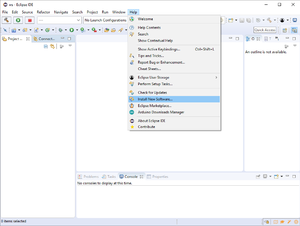
- Click on Help->Install New Software... menu entry as shown in the following figure:
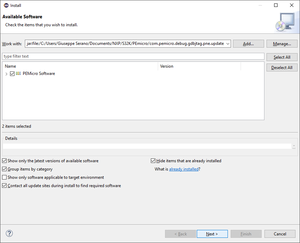
- The Available Software dialog will open as shown in the following figure:
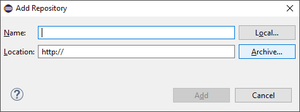
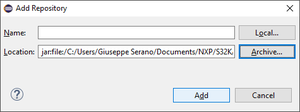
- Click on the Add... button to open the Add Repository as shown in the following figure:
- Click on Archive... button and select the previously downloaded PEMicro Eclipse Plugin (e.g. com.pemicro.debug.gdbjtag.pne.updatesite-3.0.9-SNAPSHOT.zip) package as shown in the following figure:
- Click on the Add button to confirm the PEmicro Eclipse Plugin package selection as shown in the following figure:
- Click on the PEMicro Software check-box to select the PEmicro Eclipse Plugin to install.
- Click on the Next > button to let the 'plugin requirements and dependencies calculation' process starts as shown in the following figure:
- Once the 'plugin requirements and dependencies calculation' process ends, the Installation Details dialog is opened as shown in the following figure:
- Click on the Next > button to open the Review Licenses dialog as shown in the following figure:
- Click on the I accept the terms of the license agreements radio-button to accept the license terms.
- Finally click on the Finish button to start the installation process as shown in the following figure:
- Once the installation process ends, the Software Updates dialog will appear as shown in the following figure:
- Click on the Restart Now button to restart the RT-Druid Eclipse IDE.
PEmicro OCD Configuration
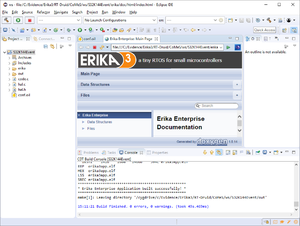
- Instatiate and build an Erika 3 application as shown in the following figure:
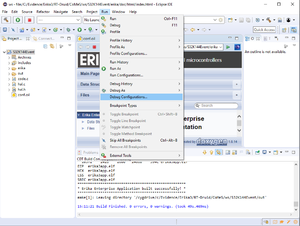
- Click on Run->Debug Configurations... menu entry as shown in the following figure:
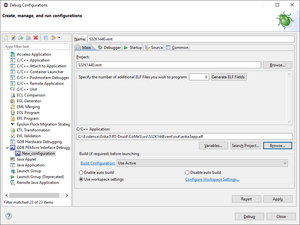
- The Debug Configuration dialog window will open as shown in the following figure:
- Select GDB PEmicro Interface Debugging entry from the left panel and click on the New lauch configuration button as shown in the previous figure.
- A New_configuration entry will be created as child of GDB PEmicro Interface Debugging entry in the left panel as shown in the following figure:
- Fill the configuration Name field (e.g. S32K144Event).
- Use the Browse... button to select the Project (e.g. S32K144Event)
- Use the Browse... button to select the C/C++ Application to debug (e.g. C:\Evidence\Erika3\RT-Druid\CoMeS\ws\S32K144Event\out\erika3app.elf)
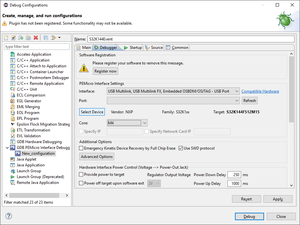
- Then click on the Debugger tab-sheet to configure the PEmicro Debugger interface as shown in the following figure:
- Use Select Device button to select the device to debug (e.g. S32K144F512M15 from NXP/S32K1xx folder).
- Scroll-down the Debugger tab-sheet to configure the GDB client as shown in the following figure:
- Use the Browse... button to select the GDB Client Executable (e.g C:\Program Files (x86)\GNU Tools ARM Embedded\4.9 2015q3\bin\arm-none-eabi-gdb.exe)
- Click on the "Apply" button to confirm the settings.
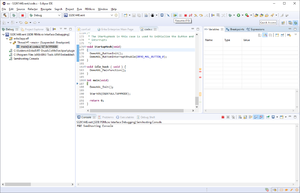
- Now you can debug the selected project using the Eclipse interface as shown in the following figure:
IMPORTANT NOTE: When debugging on Eclipse, you will need likely to set a breakpoint on your code. Breakpoints are typically set by clicking on the line number. Unfortunately, most of the times the debugger sets a wrong breakpoint, shown as a blue dot:
The "blue dot only" breakpoint is not a real breakpoint. In order to really set a breakpoint, you need to open the Disassebly View (Window -> Show View -> Disassembly), search for the function where you need to break, and then click on the instruction address. The resulting breakpoint has a different symbol which is a "ticked blue dot" as shown in the figure below
Embedded Systems Register View
The following subsections are related to the installation of the Embedded Systems Register View, which is a special view allowing the visualization of the peripheral registers of the board.
Embedded Systems Register View Eclipse Plugin Download
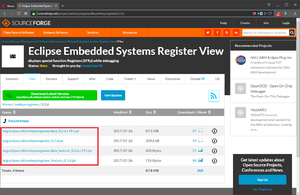
- Open your favourite web broser and go to URL Eclipse Embedded Systems Register View as shown in the following figure:
- Download the Eclipse Embedded Systems Register View JARs:
- org.eclipse.cdt.embsysregview.data_0.2.6.r191.jar
- org.eclipse.cdt.embsysregview.data_feature_0.2.6.r191.jar
- org.eclipse.cdt.embsysregview_0.2.6.jar
- org.eclipse.cdt.embsysregview_feature_0.2.6.jar
Embedded Systems Register View Eclipse Plugin Patching
The plugin as-is does not directly support the NXP S32 boards. For that reason, we need to "patch" the plugin by adding the register definition for the board we are using. in order to do that, we need to unpack the plugin, add the register definition, and pack it again.
- Extract, using your favourite zip extractor (e.g. 7-zip), the downloaded org.eclipse.cdt.embsysregview.data_0.2.6.r191.jar file (note that a jar file is a zip file!).
- Locate the CMSIS SVD file for your specific microntroller (e.g. S32K144.svd or S32K148.svd) into NXP S32 Design Studio installation path (e.g. C:\NXP\S32DS_ARM_v2.0\S32DS\S32SDK_S32K14x_EAR_0.8.6\platform\devices\S32K144\S32K144.svd)
- Copy the CMSIS SVD file into org.eclipse.cdt.embsysregview.data_0.2.6.r191\data\SVD(CMSIS)\NXP directory of the extracted jar.
- Rename the file extension of CMSIS SVD file from .svd to .xml.
- Compress the patched org.eclipse.cdt.embsysregview.data_0.2.6.r191 directory using your favourite zip compressor (e.g. 7-Zip) and name it as the original file name (org.eclipse.cdt.embsysregview.data_0.2.6.r191.jar).
- Note: when packing again, you need to repack with the same directory structure of the original file. If, when you unpacked, you unpacked in a newly created directory that has the same name of the original file, then that directory should not be included in the Zip file!
Embedded Systems Register View Eclipse Plugin Installation
- Copy the downloaded and patched JAR files into RT-Druid v3 Eclipse plugins directory (e.g. C:\Evidence\Erika3\RT-Druid\eclipse\plugins).
- Note that RT-Druid v3 must be restarted.
Embedded Systems Register View Configuration
- Run a Debug session of an ERIKA v3 application as shown in the following figure:
- Click on Window->Show View->Other... menu entry as shown in the following figure:
- The Show View dialog will appear as shown in the following figure:
- Select EmbSys Register in Debug folder
- Click on the Open button to open the EmbSys Register tab-sheet as shown in the following figure:
- Click on the "wrench" button to open the EmbSysRegView preferences dialog as shown in the following figure:
- Select SVD(CMSIS) from Architecture drop-down menu.
- Select NXP from Vendor drop-down menu.
- Select the right microcontroller (e.g. S32K144 or S32K148) from Chip drop-down menu.
- Click Apply and Close to show all the microcontroller registers into EmbSys Registers tab-sheet as shown in the following figure:
Additional Notes
T.B.D.
